Documents → a connected model
Mountains of documents and a domain become a graph with knowledge provenance, not a flat full-text index.
Knowledge platform · graph + semantic search
An engine that turns documents and a domain into a connected model: entities, relations, semantic search and knowledge provenance. A separate, reusable layer.
Mountains of documents and scattered knowledge: finding what you need by meaning rather than by keywords, and knowing where it came from, is expensive and manual.
Full-text search does not understand meaning or relations; RAG without a graph and provenance gives answers with no reference to the source and no audit.
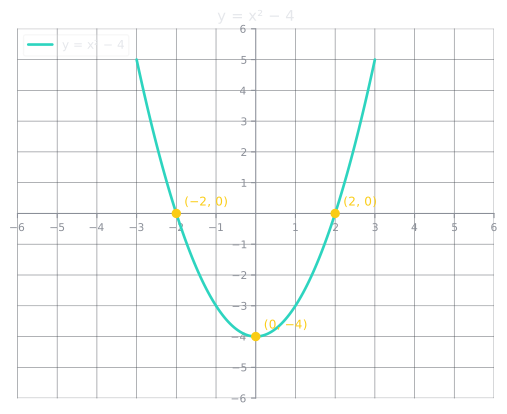
Domain and documents → a connected model with provenance; semantic search and deterministic rendering (for example, y=x²−4 → SVG). The knowledge-graph data itself is a moat: only aggregates go outside, with no weights or selection rules.
Mountains of documents and a domain become a graph with knowledge provenance, not a flat full-text index.
Answers by meaning, with a traceable source and the ability to audit — you can see where they came from.
The same input gives the same SVG — predictable rendering of diagrams and geometry, with no black box.
The function is rendered to SVG deterministically; this is derived output, not the knowledge-graph mechanism. It can be captured headless right now.
Reproduce: python -c "scene_renderer.render_graph(...)"
A deterministic layout test: 100 shapes with no overlaps at a fixed seed.
Reproduce: pytest backend/tests/test_geometry.py
The authored graph dataset, counted as of 05.10.2026. 7,464 nodes are loaded into the lab’s working graph database; the size of the graph in production has not been measured separately. We give aggregates only: weights, selection rules and the proposal→review→commit pipeline are not taken outside.
A separate, reusable knowledge layer on top of the client’s domain — graph, semantic search and provenance.
AVA is a process-economics calculator. In a couple of minutes it shows whether this pays off in your case — before any call, with no commitment.
Estimate with AVATell us what needs solving. If it cannot be solved or will not pay off, we will say so up front, before any work starts.
or write to us directly: hello@xteam.pro